A Research Perspective

Ideas Are Meaningless Without Effective Execution!
Why exceptional results are 1% idea and 99% execution, and what the evidence actually supports
- Critical integrative review
- 30 peer-reviewed sources
- 7-stage operating system
- 9-dimension diagnostic
Research stance
The 1% idea and 99% execution statement is evaluated as an aphorism, not as a fact.
The paper distinguishes evidence, inference, and author-developed tools throughout.
Executive Summary
Exceptional results do not come from ideas alone. They emerge when an organization repeatedly converts a good idea into aligned choices, coordinated behavior, learning, and sustained value.
The thesis that exceptional results are 1% idea and 99% execution captures a genuine managerial asymmetry: organizations usually generate more ideas than they can absorb, prioritize, fund, coordinate, and sustain. The exact percentages, however, are not empirically defensible. A stronger conclusion is that realized impact is multiplicative. Idea quality establishes the potential value. Execution determines whether that value survives contact with priorities, incentives, workflows, capabilities, politics, uncertainty, and time.
Bottom line: six findings for executives
Keep the provocation, retire the literal ratio
Use 1%/99% to focus attention, not to imply a measured universal law.
Treat execution as an organizational capability
Execution is a system of choices, ownership, resources, coordination, feedback, adaptation, and sustainment, not simply effort.
Protect idea quality and strategic fit
Perfect execution of a poor, unethical, or misaligned idea can create efficient failure.
Manage the conversion losses
Ideas stall during elaboration, championing, resourcing, workflow integration, adoption, learning, or institutionalization.
Measure implementation and outcomes separately
Track adoption, feasibility, fidelity, cost, reach, and sustainability alongside customer, workforce, financial, and mission results.
Build learning velocity
Progress monitoring helps, but feedback can undermine performance when it is late, threatening, ambiguous, or self-focused.
Defensible thesis
In idea-rich organizations, execution is usually the scarcer and more decisive capability.
Exceptional results arise from the interaction of idea quality, strategic fit, execution capability, learning velocity, and persistence.
Method and standard of evidence
This paper uses a critical integrative review rather than a statistical meta-analysis. It synthesizes peer-reviewed evidence from strategy implementation, creativity and innovation, implementation science, organizational readiness, leadership, psychological safety, goal-setting, action planning, progress monitoring, and feedback.
| Evidence role | How it was used |
|---|---|
| Strongest weight | Meta-analyses, systematic reviews, randomized evidence, validated scales, and convergent findings across disciplines. |
| Moderate weight | Longitudinal or field studies with clear constructs and appropriate comparison or multilevel analysis. |
| Contextual weight | Influential conceptual models, case studies, and formal theory used to explain mechanisms or boundary conditions. |
| Excluded as proof | Consulting slogans, unsourced failure rates, testimonial case studies, and the 1%/99% ratio itself. |
The 1%/99% claim: useful hypothesis, not a law
The statement works rhetorically because leaders routinely observe a large gap between ideation and realized impact. It fails scientifically when presented as a fixed ratio. No credible cross-industry evidence establishes that idea quality contributes exactly 1% and execution 99% to exceptional performance. The strongest replacement is not a different percentage. It is a conditional model.

Interactive: the multiplicative impact model
Set each factor from 0 to 10. Because impact is multiplicative rather than additive, a single weak factor collapses the product no matter how strong the others are. Watch the weakest link.
The index is the product of the five factors divided by 10 to the fifth power, scaled to 100. It is a conceptual heuristic from the multiplicative model, not a fitted or validated equation.
Why multiplicative thinking is superior
| Configuration | Likely result |
|---|---|
| High-quality idea, weak execution | Potential value remains unrealized; the organization learns little because the idea never receives a fair operational test. |
| Weak idea, strong execution | The organization may scale waste, risk, or harm more efficiently. |
| Good idea and execution, weak fit | Activity may be competent but strategically irrelevant or mistimed. |
| Good idea, fit, and execution, slow learning | The organization persists with flawed assumptions or adapts after competitors and conditions have moved. |
| All factors strong | The idea is translated into reliable behavior, evidence is generated, and value can be sustained or scaled. |
From creativity to innovation: where ideas stall
Creativity and innovation are related but distinct. Creativity involves generating novel and useful ideas. Innovation extends beyond idea generation to implementation and realized change (Anderson et al., 2014; Acar et al., 2024). Treating an idea as an outcome collapses a multistage journey into its first step.
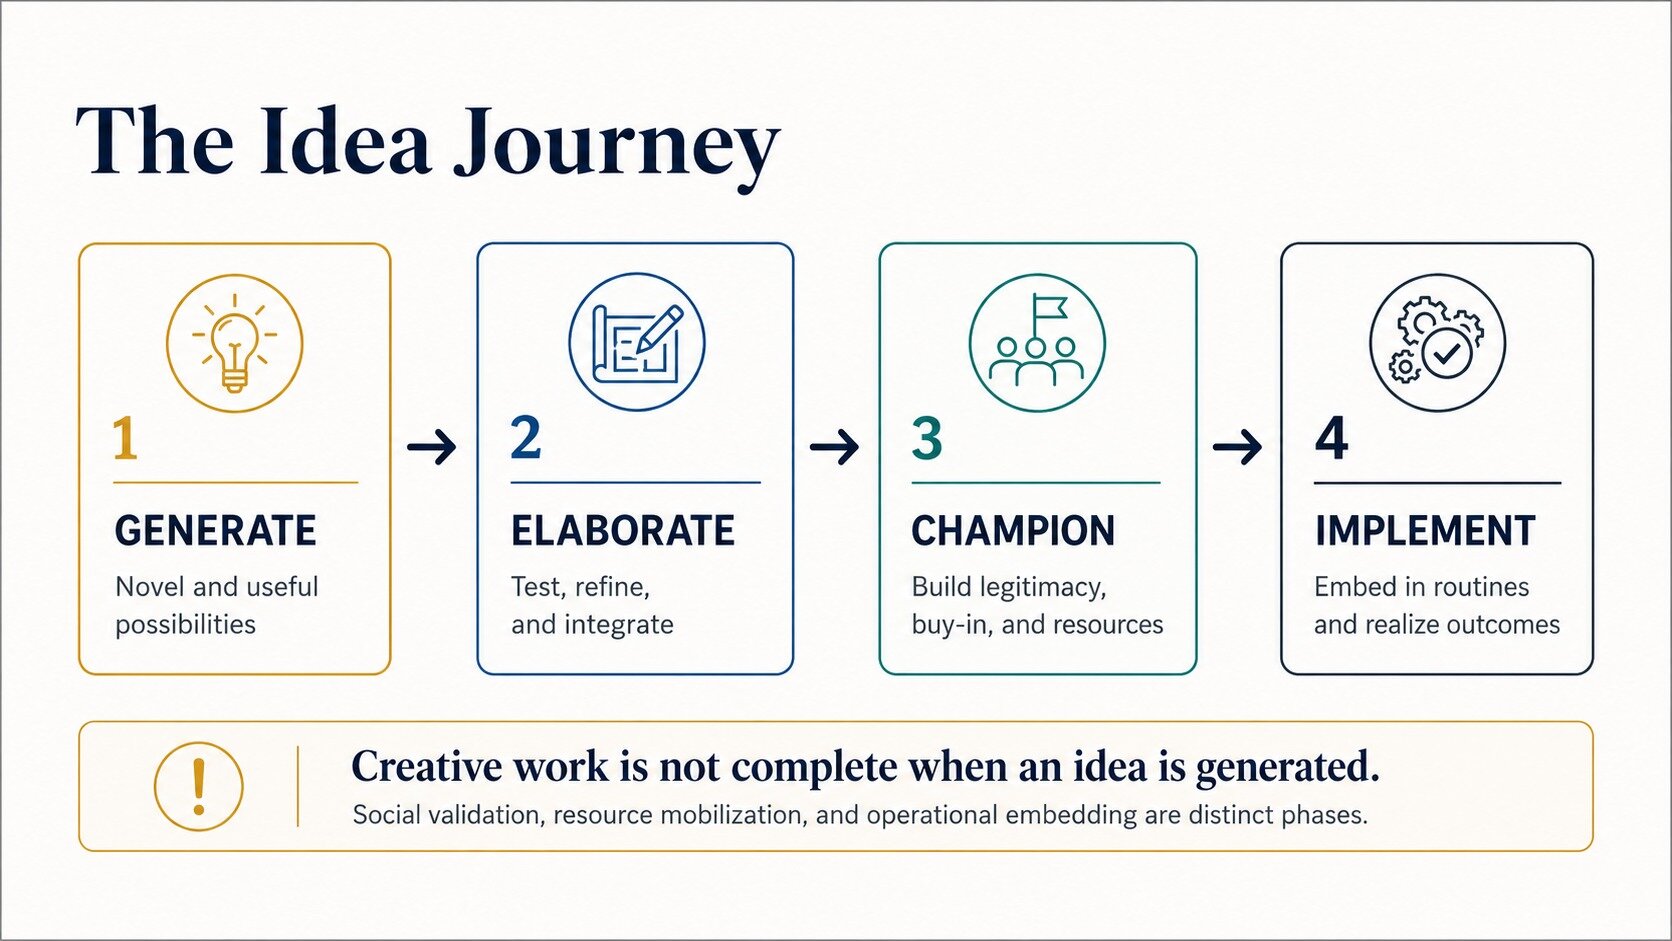
Generation
Producing the novel, useful idea
Elaboration
Developing and evaluating the idea
Championing
Building the coalition and support
Implementation
Converting the idea into realized change
Creativity does not automatically become implementation
In a field study of 216 employees and 87 supervisors, creativity and implementation were weakly correlated, and the relationship was not statistically significant (r = .13). Implementation was more likely when employees expected positive outcomes and possessed the networking ability or strong implementation ties needed to mobilize support (Baer, 2012). The study does not imply that creativity is unimportant. It shows that creative merit is not self-executing. The more original an idea is, the more it may threaten existing roles, identities, routines, status, and resource allocations. Novelty can therefore increase both potential value and implementation friction.
The five conversion losses
Selection loss
Promising ideas are crowded out by urgency, sponsorship bias, or an overloaded portfolio.
Translation loss
The idea remains a concept rather than becoming decisions, behaviors, roles, milestones, and resource commitments.
Mobilization loss
People do not see the value, lack confidence, or cannot access the capability and support required to act.
Operational loss
Dependencies, incentives, workflows, handoffs, and governance are misaligned with the change.
Learning and sustainment loss
Teams collect activity data without learning, adapt too late, or fail to embed the change after initial launch.
The intention-to-action gap
Organizations often treat agreement as if it were behavior. Behavioral science shows why this is dangerous. In a meta-analysis of 47 experimental tests, interventions changed intentions by a medium-to-large amount (d = .66) but changed behavior by a smaller amount (d = .36) (Webb & Sheeran, 2006). The result does not directly measure corporate strategy execution, but it establishes a general conversion problem: stronger intention is not equivalent to completed action.
The intention-to-behavior conversion gap (standardized mean differences)
Source: Webb and Sheeran (2006), 47 experimental tests. Values are standardized mean differences as published.

What closes part of the gap
Implementation intentions convert a goal into a pre-decided response: if situation X occurs, then I will perform behavior Y. A classic meta-analysis reported a medium-to-large overall effect on goal attainment across 94 independent tests (Gollwitzer & Sheeran, 2006). A more recent meta-analysis covering 642 tests found positive effects across cognitive, affective, and behavioral outcomes, with stronger effects when plans used a contingent if-then format, motivation was high, and the plan was rehearsed (Sheeran et al., 2025).
At the organizational level, the analog is explicit contingency planning. If a dependency is delayed, who decides? If adoption falls below the threshold, what diagnostic is triggered? If the quality guardrail deteriorates, who pauses the rollout? Good plans reduce the need to invent responses under pressure.
From abstract commitment to executable specification
“Improve customer experience.”
Reduce first-contact resolution failures from baseline to target by date, with a named process owner and weekly diagnostic review.
“Strengthen accountability.”
Assign a decision owner, publish the dependency owners, define escalation thresholds, and review unresolved commitments every 7 days.
“Increase adoption.”
Define the target user group, required behavior, enabling conditions, adoption measure, support pathway, and stop-or-redesign threshold.
“Be more innovative.”
Reserve a bounded experimentation portfolio, predefine learning questions, protect test resources, and fund only ideas that meet progression criteria.
What the evidence says about execution supports
Execution improves when goals, monitoring, feedback, and coordination are designed as a coherent system. The evidence does not support a simplistic more-is-better conclusion. Specific difficult goals can improve performance, progress monitoring can support goal attainment, and feedback can help. Each can also misfire when measures distort behavior, feedback threatens identity, or local goals undermine interdependent work.
Selected evidence on execution supports (standardized effects, not directly comparable)
Sources: Kleingeld et al. (2011), Harkin et al. (2016), Kluger and DeNisi (1996). Effects come from different literatures and are shown side by side for orientation only.

Four design implications
| Mechanism | Evidence | Leadership design rule |
|---|---|---|
| Goals | Specific, difficult group goals showed a larger average effect than nonspecific goals (d = .80 across 23 effect sizes). | Use a shared outcome goal when work is interdependent. Avoid narrow individual targets that reward local optimization. |
| Monitoring | Across 138 randomized studies with 19,951 participants, progress monitoring improved goal attainment (d = .40). | Increase monitoring frequency, physically record progress, and make appropriate results visible. Monitor outcomes and leading behaviors. |
| Feedback | Across 607 effect sizes and 23,663 observations, feedback improved performance on average (d = .41), but more than one-third of effects were negative. | Focus feedback on the task, the gap, and the next action. Reduce delay, ambiguity, and self-threatening framing. |
| Contingency plans | Implementation intentions produced positive effects across 642 tests, especially in the contingent if-then form. | Predefine responses to predictable barriers, thresholds, and decision points rather than improvising during escalation. |
What strategy-implementation research can and cannot tell us
A 2025 systematic review of 160 papers organized implementation evidence around managerial and organizational levers, including leadership, structures, internal processes, and an environment capable of continuous change (Holm et al., 2026). The review is valuable because it integrates a fragmented field. It also reveals why executives should be cautious about universal prescriptions.
Research perspective across 160 reviewed papers
Source: Holm et al. (2026).
Levels of analysis studied
Source: Holm et al. (2026).

Forty percent of reviewed studies took a top-management perspective, while 72% examined only one level of analysis, and just 7% crossed more than two levels. This matters because execution is inherently multilevel. A board may authorize a strategy, an executive team may translate it, middle managers may sequence it, and frontline teams may adapt it to real work. A study at only one level can miss the handoff failures between them.
The failure-rate problem
The common claim that 70% to 90% of strategies fail should not be used as a scientific premise. Cándido and Santos (2015) found that published estimates ranged from 28% to 90% and that the underlying evidence was often outdated, unclear, or weak. Differences in what counts as strategy, implementation, failure, and time horizon make a single universal rate implausible.
Published strategy failure rate estimates span 28% to 90%
Source: Cándido and Santos (2015). A range this wide, and this weakly sourced, cannot function as evidence.
Board-level replacement question
Do not ask whether we are in the 70% that fail.
Ask what evidence shows that the intended behaviors are occurring, that the mechanism is working, and that the value is being sustained without unacceptable tradeoffs.
Convergent levers across disciplines
| Lever | Operational meaning |
|---|---|
| Strategic coherence | Few priorities, explicit tradeoffs, and a clear theory of value creation. |
| Translation | Concrete behaviors, decisions, owners, milestones, dependencies, and resource commitments. |
| Readiness | Shared commitment to the change and shared confidence in collective capability. |
| Implementation climate | Policies, practices, rewards, and routines that signal the change is expected, supported, and rewarded. |
| Cross-boundary coordination | Reliable handoffs, escalation, and decision rights across functions and levels. |
| Learning | Frequent progress evidence, psychological safety, disciplined interpretation, and adaptive response. |
| Institutionalization | Embedding the change in roles, workflows, budgets, technology, measurement, and leadership attention. |
Execution is a chain of handoffs
Enterprise execution crosses authority levels and professional boundaries. Boards authorize direction, executives make portfolio tradeoffs, middle managers translate priorities into capacity and workflow, and frontline teams adapt the change to real operating conditions. Value is lost when the meaning, authority, resources, or evidence requirements change silently at any handoff. Each handoff needs a translation contract: what outcome is sought, which elements are nonnegotiable, what can be adapted, who owns the next decision, what evidence is required, and when an issue must be escalated.
The Execution Conversion System
The Execution Conversion System (ECS) synthesizes the evidence into a recurring operating loop. It is intentionally broader than project management. A project can be on time while adoption is weak, behavior does not change, or value does not materialize. ECS begins with value and ends with sustainment, while preserving a feedback path for adaptation.

Explore the seven stages
Select a stage to see the executive work and the required output. ECS is recursive rather than linear: evidence collected during operation can require a return to translation, sequencing, or even the original value thesis. Re-entry is not failure when it is deliberate and evidence-based.
Core design principle
Standardize the causal core, adapt the delivery edge.
Leaders should protect the elements believed to create value while allowing local adaptation in workflow, sequencing, communication, and support when evidence warrants it.
Leadership as an execution system
Execution leadership is not the repeated demand for accountability. It is the design of conditions that makes accountable behavior clear, feasible, supported, observable, and consequential. The Implementation Leadership Scale describes four relevant leader behaviors: proactive, knowledgeable, supportive, and perseverant (Aarons et al., 2014). These behaviors are more operational than generic sponsorship.
| Behavior | What it means | Observable practice |
|---|---|---|
| Proactive | Anticipates barriers, protects capacity, and clarifies decisions before work stalls. | Pre-mortem, dependency review, contingency plan. |
| Knowledgeable | Understands the change, its mechanism, and the work required at the point of delivery. | Frontline observation, mechanism review, evidence briefing. |
| Supportive | Provides time, resources, coaching, barrier removal, and a fair response to learning signals. | Capability plan, rapid escalation pathway, protected test capacity. |
| Perseverant | Maintains attention through setbacks while allowing evidence-based adaptation or termination. | Decision log, stop or scale thresholds, sustained cadence. |
Readiness is shared, not merely individual
Organizational readiness for change consists of shared change commitment and shared change efficacy (Weiner, 2009). Commitment concerns whether members value the change enough to act on it. Efficacy concerns whether the group believes it can coordinate the tasks, resources, and constraints required. A communication campaign may influence commitment, but it cannot substitute for staffing, time, expertise, infrastructure, or workable task design.
Shared change commitment
Do members value the change enough to act on it?
Shared change efficacy
Does the group believe it can coordinate the tasks, resources, and constraints required?
Psychological safety supports learning, not comfort
Psychological safety is a shared belief that a team is safe for interpersonal risk-taking. In Edmondson’s study of 51 manufacturing teams, psychological safety was associated with learning behavior, which in turn helped explain performance differences (Edmondson, 1999). A later meta-analysis synthesized 136 independent samples involving more than 22,000 individuals and nearly 5,000 groups, reinforcing the relevance of psychological safety to learning and performance-related outcomes (Frazier et al., 2017).
In practice, psychological safety serves a specific function: it shortens the time between when bad news becomes knowable and when leaders are willing to hear it. It is compatible with demanding standards. Teams need both candor and consequences, both voice and disciplined follow-through.
Leadership failure mode
Changing priorities faster than the operating system can absorb them creates strategic debt.
Unfinished work, broken commitments, hidden overload, and declining trust in future priorities.
Measure the conversion, not just the outcome
Outcome measures alone are lagging and ambiguous. When results disappoint, leaders need to know whether the idea was weak, implementation was weak, context changed, adoption was incomplete, or the causal mechanism was wrong. Implementation science offers a useful taxonomy of implementation outcomes: acceptability, adoption, appropriateness, feasibility, fidelity, cost, penetration, and sustainability (Proctor et al., 2011).
The three-layer measurement architecture
Implementation
Question: Is the change being used, by whom, where, how consistently, at what cost, and can it be sustained?
Measures: Adoption, reach, fidelity to core, feasibility, implementation cost, penetration, and sustainability.
Mechanism
Question: Is the proposed causal pathway actually changing?
Measures: Cycle time, error rate, handoff reliability, decision latency, customer effort, skill demonstration, and behavior frequency.
Value
Question: Are outcomes improving for customers, patients, workforce, mission, and enterprise performance?
Measures: Quality, safety, experience, access, productivity, revenue, margin, retention, equity, and strategic position.
A disciplined scorecard
Each initiative should have a small set of measures that jointly tell a causal story. The scorecard should include an outcome, one or two mechanism indicators, implementation evidence, and a guardrail. More data does not necessarily create more learning. The purpose is to shorten the interval between the signal and the decision.
| Measure class | Purpose | Review cadence |
|---|---|---|
| Value outcome | What consequential result should change? | Monthly or appropriate lagging cadence |
| Leading mechanism | What behavior or process should move first if the theory is correct? | Weekly |
| Implementation | Who is adopting, with what fidelity, feasibility, reach, and cost? | Weekly to monthly |
| Guardrail | What must not deteriorate while the target improves? | Same cadence as primary risk |
| Learning decision | What evidence will trigger continue, adapt, pause, stop, or scale? | At pre-specified review points |
Evidence discipline
A red metric is not a verdict. It is a trigger for diagnosis.
A green metric is not proof either. It is a signal to test whether the improvement is causal, durable, and free of hidden tradeoffs.
A 90-day executive execution system
Ninety days is long enough to create meaningful evidence and short enough to preserve urgency. The goal is not to finish a transformation in one quarter. It is to establish a reliable conversion loop, produce credible learning, and decide what should stop, adapt, continue, or scale.
| Phase | Leadership work | Minimum evidence |
|---|---|---|
| Days 0 to 15: Define and choose | Clarify the value thesis, baseline, beneficiaries, mechanism, ethical constraints, portfolio tradeoffs, and executive decision owner. | One-page charter, baseline, stop or defer list, capacity confirmation. |
| Days 16 to 30: Translate and prepare | Specify behaviors, owners, dependencies, milestones, readiness risks, capability gaps, measures, and if-then contingencies. | Dependency map, behavior specification, readiness and capability plan. |
| Days 31 to 60: Operate and learn | Launch in a bounded setting, monitor weekly, close decisions, surface workarounds, examine variation, and adapt delivery while protecting the core mechanism. | Weekly evidence reviews, decision log, learning backlog, and resolved escalations. |
| Days 61 to 75: Validate | Test whether implementation, mechanism, and value indicators are moving together, and examine unintended consequences and subgroup differences. | Evidence review, causal plausibility assessment, guardrail analysis. |
| Days 76 to 90: Decide | Scale, continue, adapt, pause, or stop. Institutionalize ownership, resources, measures, and capability if continuing. | Decision memo, sustainment or exit plan, next-quarter commitments. |
Operating cadence
| Cadence | Agenda | Required output |
|---|---|---|
| Weekly execution review, 45 minutes | Outcomes and leading signals, open commitments, threshold breaches, dependencies, decisions needed. | Named decision owner, decision within the meeting or an explicit deadline. |
| Biweekly learning review, 60 minutes | Assumptions tested, variation, frontline evidence, adaptations, unintended effects. | Updated learning log and next test. |
| Monthly portfolio review, 90 minutes | Capacity, strategic fit, initiative load, cross-initiative dependencies, stop, defer or scale decisions. | Reallocated capacity and published priority order. |
| Quarterly value review | Implementation, mechanism, outcomes, guardrails, sustainability, and strategic relevance. | Continue, adapt, pause, stop, or scale. |
Decision rules
Scale
Only when implementation, mechanism, and value evidence are directionally coherent.
Adapt
When the value thesis remains plausible, but delivery, fit, or capability is constraining implementation.
Pause
When safety, quality, equity, ethics, or material guardrails deteriorate.
Stop
When the value thesis is no longer credible, strategic fit has changed, or opportunity cost exceeds expected value.
Sustain
Only when ownership, resources, workflows, technology, measurement, and local capability can survive the original project team.
Execution maturity and diagnostic scorecard

Maturity is not the number of templates an organization uses. It is the reliability with which the operating system makes choices, converts them into behavior, generates evidence, and adapts or stops. A mature organization can still fail. Its advantage is that failures become visible earlier, learning is faster, and resources are reallocated more quickly.
Interactive executive diagnostic
Score each dimension from 1 to 5. 1 is absent, 2 is inconsistent, 3 is defined, 4 is reliable, 5 is adaptive and sustained. Because the model is multiplicative, a very low score on a critical dimension dominates the result, so the overall band is capped by your weakest critical dimension.
Value clarity Critical
The problem, beneficiary, baseline, outcome, mechanism, and guardrails are explicit.
Strategic fit
The initiative is linked to a few priorities and involves explicit trade-offs with competing work.
Translation
Required behaviors, decisions, owners, milestones, dependencies, and contingencies are specified.
Capacity Critical
Time, skills, funding, technology, data, and leadership attention are protected.
Readiness Critical
Stakeholders value the change and believe the organization can execute it.
Operating cadence
Commitments, evidence, risks, and decisions are reviewed at a reliable frequency.
Learning climate
Bad news travels quickly, and teams can surface uncertainty and correct course without blame avoidance.
Measurement Critical
Implementation, mechanism, value, and guardrail measures form a coherent causal story.
Sustainment Critical
Ownership and capability can persist after the project team or sponsor moves on.
Dimension profile
The maturity model and scorecard are author-developed syntheses. They are practical heuristics, not validated psychometric instruments. Scores are computed in your browser and are not stored or transmitted.
Common failure modes and executive countermeasures
Select a failure mode to see its diagnostic signal, the countermeasure, and the evidence worth tracking.
Most important cultural shift
Move from proving the original idea was right to discovering what produces value.
This preserves ambition while making evidence, not ego, the basis of persistence.
Counterarguments the paper concedes
| Counterargument | The response |
|---|---|
| Breakthrough ideas are rare and decisive | Correct in some contexts. In frontier science, platform technologies, and high-uncertainty markets, idea quality and timing can dominate. The thesis is strongest in idea-rich organizations with chronic conversion failure. |
| Superior execution can become efficient mediocrity | Correct. Execution capability must include environmental sensing, experimentation, and the willingness to terminate obsolete priorities. Learning velocity is therefore a separate factor. |
| “Execution” can become code for pressure | Correct when leaders reduce execution to urgency and compliance. Sustainable execution requires capacity, work design, coordination, psychological safety, and fair tradeoffs. |
| Adaptation can reduce fidelity | Correct. Leaders need a core-edge distinction: protect the causal core, document adaptations, and evaluate whether changes preserve the mechanism. |
| Positive results can be delayed | Correct. That does not justify blind persistence. It requires leading mechanisms, explicit time-to-value assumptions, staged commitments, and prespecified evidence thresholds. |
First move
Choose one consequential initiative and run the 90-day Execution Conversion System.
Do not scale the framework across the enterprise until the organization has learned where its own conversion losses occur.
References
Filter the reference list by evidence domain. All 30 sources link to their DOI.
- Aarons, G. A., Ehrhart, M. G., & Farahnak, L. R. (2014). The Implementation Leadership Scale (ILS): Development of a brief measure of unit-level implementation leadership. Implementation Science, 9, 45.DOI
- Acar, O. A., Tarakci, M., & van Knippenberg, D. (2024). Collective creativity and innovation: An interdisciplinary review, integration, and research agenda. Journal of Management, 50(6), 2119–2151.DOI
- Amabile, T. M., & Pratt, M. G. (2016). The dynamic componential model of creativity and innovation in organizations: Making progress, making meaning. Research in Organizational Behavior, 36, 157–183.DOI
- Anderson, N., Potočnik, K., & Zhou, J. (2014). Innovation and creativity in organizations: A state-of-the-science review, prospective commentary, and guiding framework. Journal of Management, 40(5), 1297–1333.DOI
- Baer, M. (2012). Putting creativity to work: The implementation of creative ideas in organizations. Academy of Management Journal, 55(5), 1102–1119.DOI
- Cándido, C. J. F., & Santos, S. P. (2015). Strategy implementation: What is the failure rate? Journal of Management & Organization, 21(2), 237–262.DOI
- Damschroder, L. J., Reardon, C. M., Widerquist, M. A. O., & Lowery, J. (2022). The updated Consolidated Framework for Implementation Research based on user feedback. Implementation Science, 17, 75.DOI
- Durlak, J. A., & DuPre, E. P. (2008). Implementation matters: A review of research on the influence of implementation on program outcomes and the factors affecting implementation. American Journal of Community Psychology, 41, 327–350.DOI
- Edmondson, A. C. (1999). Psychological safety and learning behavior in work teams. Administrative Science Quarterly, 44(2), 350–383.DOI
- Frazier, M. L., Fainshmidt, S., Klinger, R. L., Pezeshkan, A., & Vracheva, V. (2017). Psychological safety: A meta-analytic review and extension. Personnel Psychology, 70(1), 113–165.DOI
- Gollwitzer, P. M., & Sheeran, P. (2006). Implementation intentions and goal achievement: A meta-analysis of effects and processes. Advances in Experimental Social Psychology, 38, 69–119.DOI
- Harkin, B., Webb, T. L., Chang, B. P. I., Benn, Y., Prestwich, A., Conner, M., Kellar, I., & Sheeran, P. (2016). Does monitoring goal progress promote goal attainment? A meta-analysis of the experimental evidence. Psychological Bulletin, 142(2), 198–229.DOI
- Heide, M., Grønhaug, K., & Johannessen, S. (2002). Exploring barriers to the successful implementation of a formulated strategy. Scandinavian Journal of Management, 18(2), 217–231.DOI
- Holm, C. G., Kringelum, L., & Anand, A. (2026). Creating effective strategy implementation: A systematic review of managerial and organizational levers. Review of Managerial Science, 20, 673–705.DOI
- Hrebiniak, L. G. (2006). Obstacles to effective strategy implementation. Organizational Dynamics, 35(1), 12–31.DOI
- Klein, K. J., & Sorra, J. S. (1996). The challenge of innovation implementation. Academy of Management Review, 21(4), 1055–1080.DOI
- Kleingeld, A., van Mierlo, H., & Arends, L. (2011). The effect of goal setting on group performance: A meta-analysis. Journal of Applied Psychology, 96(6), 1289–1304.DOI
- Kluger, A. N., & DeNisi, A. (1996). The effects of feedback interventions on performance: A historical review, a meta-analysis, and a preliminary feedback intervention theory. Psychological Bulletin, 119(2), 254–284.DOI
- Lee, E., & Puranam, P. (2016). The implementation imperative: Why one should implement even imperfect strategies perfectly. Strategic Management Journal, 37(8), 1529–1546.DOI
- Locke, E. A., & Latham, G. P. (2002). Building a practically useful theory of goal setting and task motivation: A 35-year odyssey. American Psychologist, 57(9), 705–717.DOI
- Noble, C. H. (1999). The eclectic roots of strategy implementation research. Journal of Business Research, 45(2), 119–134.DOI
- Perry-Smith, J. E., & Mannucci, P. V. (2017). From creativity to innovation: The social network drivers of the four phases of the idea journey. Academy of Management Review, 42(1), 53–79.DOI
- Powell, B. J., Waltz, T. J., Chinman, M. J., Damschroder, L. J., Smith, J. L., Matthieu, M. M., Proctor, E. K., & Kirchner, J. E. (2015). A refined compilation of implementation strategies: Results from the Expert Recommendations for Implementing Change project. Implementation Science, 10, 21.DOI
- Proctor, E. K., Bunger, A. C., Lengnick-Hall, R., Gerke, D. R., Martin, J. K., Phillips, R. J., & Swanson, J. C. (2023). Ten years of implementation outcomes research: A scoping review. Implementation Science, 18, 31.DOI
- Proctor, E., Silmere, H., Raghavan, R., Hovmand, P., Aarons, G., Bunger, A., Griffey, R., & Hensley, M. (2011). Outcomes for implementation research: Conceptual distinctions, measurement challenges, and research agenda. Administration and Policy in Mental Health and Mental Health Services Research, 38(2), 65–76.DOI
- Sheeran, P., Listrom, O., & Gollwitzer, P. M. (2025). The when and how of planning: Meta-analysis of the scope and components of implementation intentions in 642 tests. European Review of Social Psychology, 36(1), 22–86.DOI
- van Mierlo, H., & Kleingeld, P. A. M. (2010). Goals, strategies, and group performance: Some limits of goal setting in groups. Small Group Research, 41(5), 524–555.DOI
- Webb, T. L., & Sheeran, P. (2006). Does changing behavioral intentions engender behavior change? A meta-analysis of the experimental evidence. Psychological Bulletin, 132(2), 249–268.DOI
- Weiner, B. J. (2009). A theory of organizational readiness for change. Implementation Science, 4, 67.DOI
- Yang, M.-J., Christensen, M., Bloom, N., Sadun, R., & Rivkin, J. W. (2026). How do chief executive officers make a strategy? Management Science, 72(6), 4569–4596.DOI
Ideas Are Meaningless Without Effective Execution! · Kelly Emrick, DHSc, PhD, MBA, BSRT(ARRT)R
The Execution Conversion System, the multiplicative impact model, the maturity model, and the scorecard are author-developed syntheses. They are practical heuristics, not validated psychometric instruments. This dashboard is educational and does not constitute management consulting advice for any specific organization.