
Leadership: Are We Measuring the Wrong Performance Metrics?
What hospital leadership rewards reveal about success and accountability.
- Six-domain scorecard
- Weight stability test
- Board self-assessment
- 90-day shadow plan
- 11 sources
Which verified results justified the reward?
A hospital can meet its financial targets while leaving consequential questions about care unanswered. Leadership is tested by whether the board can link rewards to independently verified results for patients, the workforce, and the community.
THE PRINCIPLE
A summary score may be useful for a defined purpose, but it should not erase a material safety or integrity concern.
The evidence does not support a universal claim that boards ignore care or that higher executive compensation causes worse outcomes. Studies differ, use different samples, and often measure earlier periods.
The more defensible concern is that readily measured growth and financial results can become persuasive substitutes for a complete account of mission performance. This model preserves financial sustainability while making patient outcomes, access, workforce capability, affordability, and governance visible.
Read the pattern carefully
Compensation associations are a reason to investigate. They do not establish motive or prove that pay caused a clinical outcome.
Keep the whole profile
Financial resilience, patient outcomes, access, workforce, community benefit, and governance answer different questions.
Make the decision reviewable
Document the rules, independently validate results, review material failures, and explain reward and remediation decisions.
Two questions. Four situations.
Is the organization financially capable of sustaining its commitments? Are those commitments producing credible results for the people it serves? The same reported margin can coexist with very different answers to the second question.
Stronger finances and stronger mission results. Verify sustainability, local variation, and unresolved exceptions before declaring success.
Move the sliders to place an organization conceptually. Positions are discussion prompts, not measured ratings, validated thresholds, or ratings of real hospitals.
View the matrix as published

When the proxy becomes the result
Nine ways a reported number can look better without the underlying performance improving. Dots mark the scorecard domains each trap exposes, as described in the report.
Completed-visit denominators
Shorter waits among completed visits can conceal patients who never obtained an appointment. Report unresolved referrals separately.
Domains exposed: 1 of 6Reporting behavior
Better incident reporting can raise recorded harm. Do not reward fewer reported incidents without checking reporting behavior.
Domains exposed: 1 of 6Staff classification
Involuntary or transferred staff classifications can alter turnover measures. Audit them before trusting the trend.
Domains exposed: 1 of 6Spending mistaken for benefit
Community benefit dollars are not demonstrated community outcomes. Review application abandonment and denial reasons.
Domains exposed: 1 of 6Burden shifting
A better margin can move costs onto patients, staff, or future periods. Ask what produced the savings.
Domains exposed: 1 of 6Administrative closure
An administratively closed corrective action does not prove the problem was resolved. Verify closure independently.
Domains exposed: 1 of 6The system average
A system average may improve while one community loses a service. Keep facility and service level detail.
Domains exposed: 6 of 6Short reporting windows
An annual bonus may rest on a short window, while prevention, staffing stability, and access improvements develop over several years.
Domains exposed: 3 of 6Completion mistaken for benefit
Closing a deal or meeting a synergy budget is a milestone. Follow service availability, outcomes, affordability, and workforce continuity.
Domains exposed: 4 of 6Dot order: Patient outcomes · Timely access · Workforce capability · Affordability · Financial sustainability · Governance and trust.
What the research can establish
Published observations support scrutiny. They do not prove individual motives or causal effects. Every value keeps its original population and period.
CEO to direct-care compensation
Largest bed-size decile; ratio to 1
Source and exact values
Jenkins (2026) ↗ Reported values; no causal effect is estimated and no intervening years are supplied.
View the published figure

Components of compensation growth
Share of the measured increase
Source and method
Jenkins, Short, and Ho (2024) ↗ The modeled baseline is a nonteaching organization below 100 beds, with zero profit and zero charity care.
View the published figure

Incentive weights are being reconsidered
SullivanCotter reported 4.1% median base-salary growth and 5.4% total-cash-compensation growth. In its separate April pulse survey, 45% of organizations changed incentive-goal weights.
Measures and samples differ; the public release does not establish national representativeness. SullivanCotter (2026) ↗
Keep contrary evidence in view
Patient satisfaction appears in the compensation evidence. The report does not claim that all boards reward financial performance alone.
| Source | Period | Contribution | Boundary |
|---|---|---|---|
| Joynt et al. (2014) | 2008 to 2009 | Patient satisfaction and technology were associated with pay | Older observational comparison; not a study of current contracts |
| Mulligan et al. (2022) | 2010 and 2015 | Mission-related and financial associations were not uniform | Measured associations do not identify each board’s decision rule |
| Jenkins et al. (2024) | 2012 to 2019 | Separates modeled components of compensation growth | Decomposition is not causal attribution or a bonus formula |
| Jenkins (2026) | 2015 to 2022 | Describes pay differences by organization size | Policy brief; changing samples and a specific care labor definition |
Six domains, one complete account
Keep financial sustainability and mission performance visible together. Select a domain for its accountable owner, candidate measurement, and balancing evidence. No universal targets or hospital ratings are assigned.
Patient outcomes and safety
Are patients safer and healthier?
Risk-adjusted outcomes using the selected measure’s published specification; selected harm rates with explicit cases and exposure denominators
Show uncertainty and service level variation. Reconcile case review with coded records. Do not reward fewer reported incidents without checking reporting behavior.
Timely access and equity
Can people complete the care they need?
Median and 90th percentile days from accepted referral to completed appointment, by service; unresolved referrals reported separately
Track cancellations, rejected referrals, transfers, and completion by relevant patient groups. Shorter waits among completed visits can conceal excluded patients.
Workforce capability and safety
Can the workforce sustain reliable care?
Voluntary direct care departures divided by average direct care headcount; monthly trend with role and facility detail
Pair retention with vacancies, overtime, competence, worker safety, and patient outcomes. Audit involuntary or transferred staff classifications.
Affordability and community benefit
Does the community experience the benefit?
Financial assistance approvals divided by completed eligible applications; separately disclose dollars at a defined accounting basis and progress on community commitments
Review application abandonment, denial reasons, patient billing complaints, and service availability. Distinguish spending from demonstrated community outcomes.
Financial sustainability
Can the organization sustain its commitments?
Operating income divided by operating revenue, with consistent treatment of unusual items; liquidity and capital maintenance shown separately
Assess payer mix, deferred maintenance, essential services, and savings sources. Explain whether improvement shifted burdens to patients, staff, or future periods.
Governance and trust
Can the board defend the decision?
Overdue material corrective actions divided by all material actions due; validation status and unresolved findings shown explicitly
Independent confirmation of closure, protected staff escalation, and review of data corrections. An administratively closed case does not prove the problem was resolved.
View the complete measurement dictionary
| Domain | Accountable owner | Candidate measure | Balancing evidence |
|---|---|---|---|
| Patient outcomes and safety | Chief medical and nursing officers | Risk-adjusted outcomes using the selected measure’s published specification; selected harm rates with explicit cases and exposure denominators | Show uncertainty and service level variation. Reconcile case review with coded records. Do not reward fewer reported incidents without checking reporting behavior. |
| Timely access and equity | Operations and access leaders | Median and 90th percentile days from accepted referral to completed appointment, by service; unresolved referrals reported separately | Track cancellations, rejected referrals, transfers, and completion by relevant patient groups. Shorter waits among completed visits can conceal excluded patients. |
| Workforce capability and safety | Nursing and human resources leaders | Voluntary direct care departures divided by average direct care headcount; monthly trend with role and facility detail | Pair retention with vacancies, overtime, competence, worker safety, and patient outcomes. Audit involuntary or transferred staff classifications. |
| Affordability and community benefit | Finance and community health leaders | Financial assistance approvals divided by completed eligible applications; separately disclose dollars at a defined accounting basis and progress on community commitments | Review application abandonment, denial reasons, patient billing complaints, and service availability. Distinguish spending from demonstrated community outcomes. |
| Financial sustainability | Chief financial officer | Operating income divided by operating revenue, with consistent treatment of unusual items; liquidity and capital maintenance shown separately | Assess payer mix, deferred maintenance, essential services, and savings sources. Explain whether improvement shifted burdens to patients, staff, or future periods. |
| Governance and trust | Board quality and audit committees | Overdue material corrective actions divided by all material actions due; validation status and unresolved findings shown explicitly | Independent confirmation of closure, protected staff escalation, and review of data corrections. An administratively closed case does not prove the problem was resolved. |
A DENOMINATOR DETERMINES WHO COUNTS
Completed appointments exclude people who never obtained one. Workforce classifications can alter turnover measures. Better incident reporting can raise recorded harm. Preserve missing data, uncertainty, local variation, and the original measurement definitions.
Owners are accountable for the measure; the verification function should be sufficiently independent of the person whose award depends on it. Targets should reflect baseline performance, achievable improvement, external standards, and statistical reliability. This report assigns no national cutoff.
The average can conceal the failure
Change the assumptions and see what a single total leaves out. Then test whether the conclusion survives small, technical changes in the weights.
Hypothetical teaching example. All scores and weights here are invented. They are not observed hospital outcomes, validated ratings, or recommended compensation rules.
Organization A
weighted composite
Organization B
80 in every domain
Both averages are 80.0. A tie in the composite can conceal different domain profiles.
Each domain weight is halved and doubled in turn to see whether the conclusion holds.
Weighted mean = Σ(score × relative weight) ÷ Σ(relative weights). Organization B is fixed at 80 in each domain. The stability test follows the report: before linking a framework to compensation, test whether the conclusion changes when weights change within plausible ranges.
View the original example as published

The domain profile remains visible regardless of the composite. This example does not award a pass, fail, or compensation recommendation.
How reviewable is your board’s judgment?
Twelve statements drawn from the report’s proposed review cycle. Rate each one for your board or committee. The radar shows which stage of the cycle is weakest.
Reflection tool, not a validated instrument. Scores are simple percentages of the maximum for each stage. There are no validated cutoffs, and the result is not a rating of governance quality. Answers stay in this browser.
Make the board’s judgment reviewable
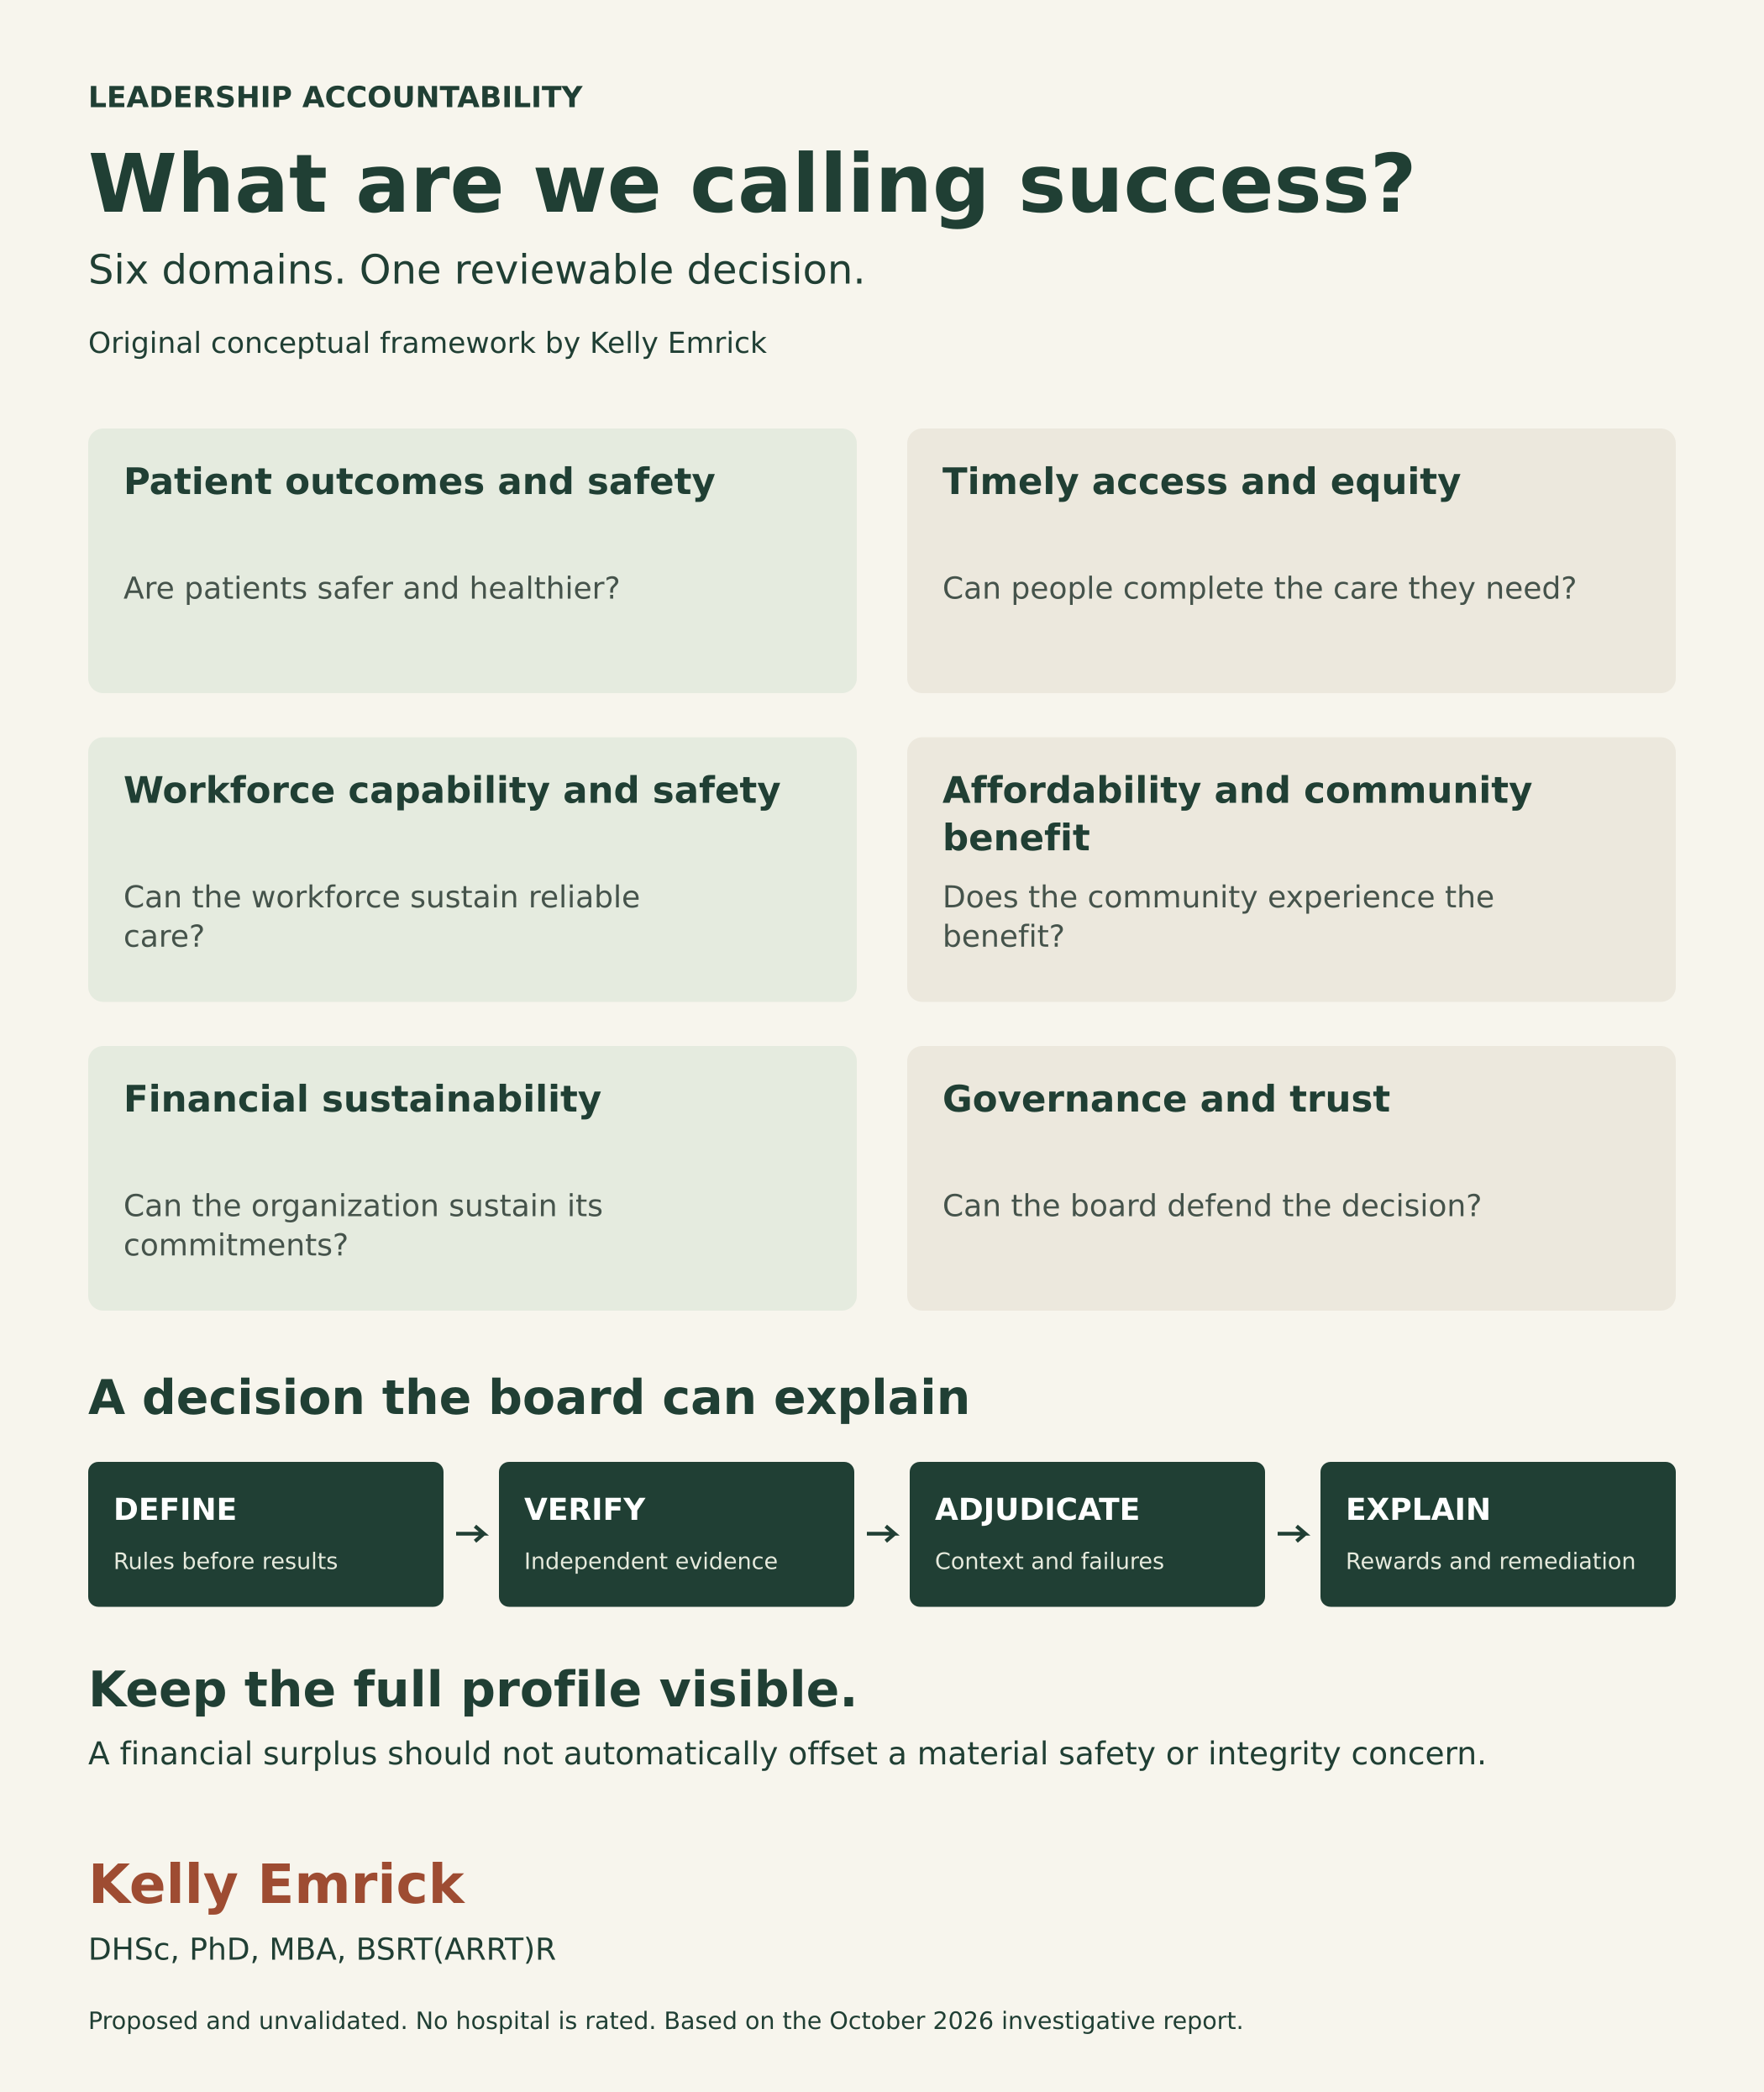
The proposed governance cycle separates four functions: defining the rules, verifying evidence, adjudicating results, and explaining the decision.
Choose measures, thresholds, exception rules, and decision rights. Preserve the original schedule and date every amendment.
A committee can delegate analytical work while retaining responsibility for the judgment. It should not ask the executive whose award is at issue to be the final authority on whether the evidence is reliable. The return arrow represents revision for a future period, not retrospective rewriting of targets.
View the review cycle as published

Start with a shadow scorecard
Use the framework alongside the existing evaluation before changing compensation. Ninety days can establish governance and a baseline; it cannot demonstrate long-term clinical effectiveness. Checked tasks track planning progress only.
Days 1 to 30 · Board quality and compensation chairs
Inventory current measures and contracts. Map responsibilities. Hear from clinical, workforce, patient, and community representatives.
Reviewable output: Approved scope, measure dictionary, data owners, conflict rules, and list of evidence gaps.
Days 31 to 60 · Quality analytics and internal audit
Reconcile a baseline. Test denominators, local variation, and missingness. Simulate review of material failures and changes in weights.
Reviewable output: Shadow scorecard with uncertainty, documented exceptions, and sensitivity analysis.
Days 61 to 90 · Joint board review
Compare independent reviewers’ conclusions. Resolve definitions. Agree on prospective rules and a schedule for longer follow-up.
Reviewable output: Record the pilot decision, remediation plan, disclosure outline, and conditions for future use.
0 of 9 planning tasks checked
Checks are remembered in this browser only and never sent to a server.
Evidence to request from the board
| Record | What it can reveal | What still needs verification |
|---|---|---|
| Compensation plan | Measures, weights, thresholds, caps, and discretion | The version approved before the period; later amendments and reasons |
| Performance packet | Reported results and comparison periods | Underlying records, exclusions, missingness, and subsidiary variation |
| Compensation decision | Award calculation and committee judgment | Treatment of missed targets, exceptions, conflicts, and remediation |
| Public filings and reports | Reported pay and selected organizational results | Comparable entities, periods, pay components, and outcome definitions |
Verification and challenge protocol
| Test | Evidence to inspect | Decision consequence |
|---|---|---|
| Match the unit and time | Executive role, legal entities, facilities, performance dates, award dates, and reporting years | Do not compare mismatched boundaries or describe an old outcome as current. |
| Reconcile the numbers | Source extracts, measure code or specifications, exclusions, corrections, and denominator counts | Flag unreconciled measures as unverified; investigate before using them to justify an award. |
| Examine the exceptions | Overrides, goal revisions, unusual items, missing facilities, and low volume groups | Explain how each exception affects the result; apply the same rules consistently. |
| Challenge the interpretation | Alternative explanations, comparison groups, clinical review, and staff or patient evidence | Separate verified observation from causal inference and management attribution. |
| Document the response | Management explanation, independent findings, committee rationale, owners, and deadlines | Record disagreement and remediation; verify completion rather than accepting a status label. |
The review process is a governance proposal. A single adverse event does not automatically determine compensation; independently reviewed facts, context, and applicable agreements remain necessary.
The model on one page
An interactive visual guide for leaders, trustees, and the communities they serve. Also available on its own with the [emrick_leadership_infographic] shortcode.
Six domains. One reviewable decision.
Success requires a complete performance profile and an explanation the board can defend.
Chief medical and nursing officers
Measure: Risk-adjusted outcomes using the selected measure’s published specification; selected harm rates with explicit cases and exposure denominators
Balance with: Show uncertainty and service level variation. Reconcile case review with coded records. Do not reward fewer reported incidents without checking reporting behavior.
A strong financial result should not automatically cancel a material safety or integrity concern.
Original conceptual model by Kelly Emrick. Proposed and unvalidated; no hospital is rated.
Evidence and interpretation
Source periods, study types, and limitations remain attached to each finding.
The growing gap between hospital CEO and direct care pay ↗
Jenkins (2026)
Largest-decile CEO-to-direct-care compensation ratios increased between the two observed years.
Interpretation: Changing yearly samples; care compensation includes benefits and full-time-equivalent standardization. This is not an individual nurse salary ratio.
doi.org/10.25613/WSJY-BZ17
The determinants of nonprofit hospital CEO compensation ↗
Jenkins, Short, and Ho (2024)
The study decomposes compensation growth into a modeled baseline shift, changed relationships with characteristics, and changed characteristics.
Interpretation: Statistical decomposition, not causal attribution or actual incentive-plan weights.
doi.org/10.1371/journal.pone.0306571
Compensation of chief executive officers at nonprofit US hospitals ↗
Joynt et al. (2014)
Pay was associated with patient satisfaction and technology, but not the measured clinical outcomes, processes, community benefit, or financial measures.
Interpretation: Older observational comparison; does not identify present-day contracts.
doi.org/10.1001/jamainternmed.2013.11537
What do nonprofit hospitals reward? ↗
Mulligan et al. (2022)
Patient satisfaction was associated with pay; financial and uncompensated-care findings were mixed.
Interpretation: The authors interpreted the evidence as consistent with balancing financial health and mission; associations do not establish a decision rule.
doi.org/10.1371/journal.pone.0264712
Health care executive compensation growth stabilizes ↗
SullivanCotter (2026)
Median base-salary growth was 4.1% and total-cash-compensation growth was 5.4%. In a separate April pulse survey, 45% changed incentive-goal weights.
Interpretation: Different survey measures and samples. The public release does not establish national representativeness of the pulse results.
sullivancotter.com/resources/health-care-executive-compensation-stabilizes
Changes in quality of care after hospital mergers and acquisitions ↗
Beaulieu et al. (2020)
Acquisition was associated with modestly worse patient experience and no significant differential mortality or readmission change.
Interpretation: Historical average, not evidence of a compensation mechanism or a verdict on an individual transaction.
doi.org/10.1056/NEJMsa1901383
Value-Based Purchasing and patient mortality ↗
Figueroa et al. (2016)
The early program was not associated with a mortality benefit in the study.
Interpretation: Hospital reimbursement differs from executive compensation; the result does not evaluate all subsequent programs.
doi.org/10.1136/bmj.i2214
Framework for effective board governance of health system quality ↗
Daley Ullem et al. (2018)
Oversight covers all dimensions of quality, trustee knowledge, improvement systems, and board culture.
Interpretation: Governance guidance, not validation of this proposed scorecard.
http://www.ihi.org/library/white-papers/framework-effective-board-governance-health-system-quality
Sample performance standards for evaluating annual incentive plans ↗
Cotter and Hastings (2019)
Quality, patient engagement, safety, and financial results were already common incentive measures.
Interpretation: Historical guidance cannot characterize every current plan.
trustees.aha.org/sample-performance-standards-evaluating-annual-incentive-plans
Linking quality to payment ↗
Centers for Medicare & Medicaid Services
Hospital purchasing uses clinical outcomes, person and community engagement, safety, and efficiency and cost reduction domains.
Interpretation: A payment methodology is not a ready-made executive compensation formula.
data.cms.gov/provider-data/topics/hospitals/linking-quality-to-payment
Rebuttable presumption: Intermediate sanctions ↗
Internal Revenue Service
The process addresses advance approval without conflicts, comparability information, and adequate timely documentation.
Interpretation: Reasonable-compensation procedures do not establish fulfillment of clinical or community mission.
How to read this dashboard
Based on the October 2026 revision of Kelly Emrick’s investigative report. Published values keep their original observation periods. The evidence is a fixed research snapshot, not a live feed. The six-domain model, matrix, review cycle, and self-assessment are proposed and unvalidated; the scenario scores are entirely hypothetical.
The report is a targeted documentary investigation, not a systematic review, audit of a named hospital, or causal estimate of executive incentives. It does not establish individual motives, contractual rules, or legal excess. No hospital or executive is rated here.
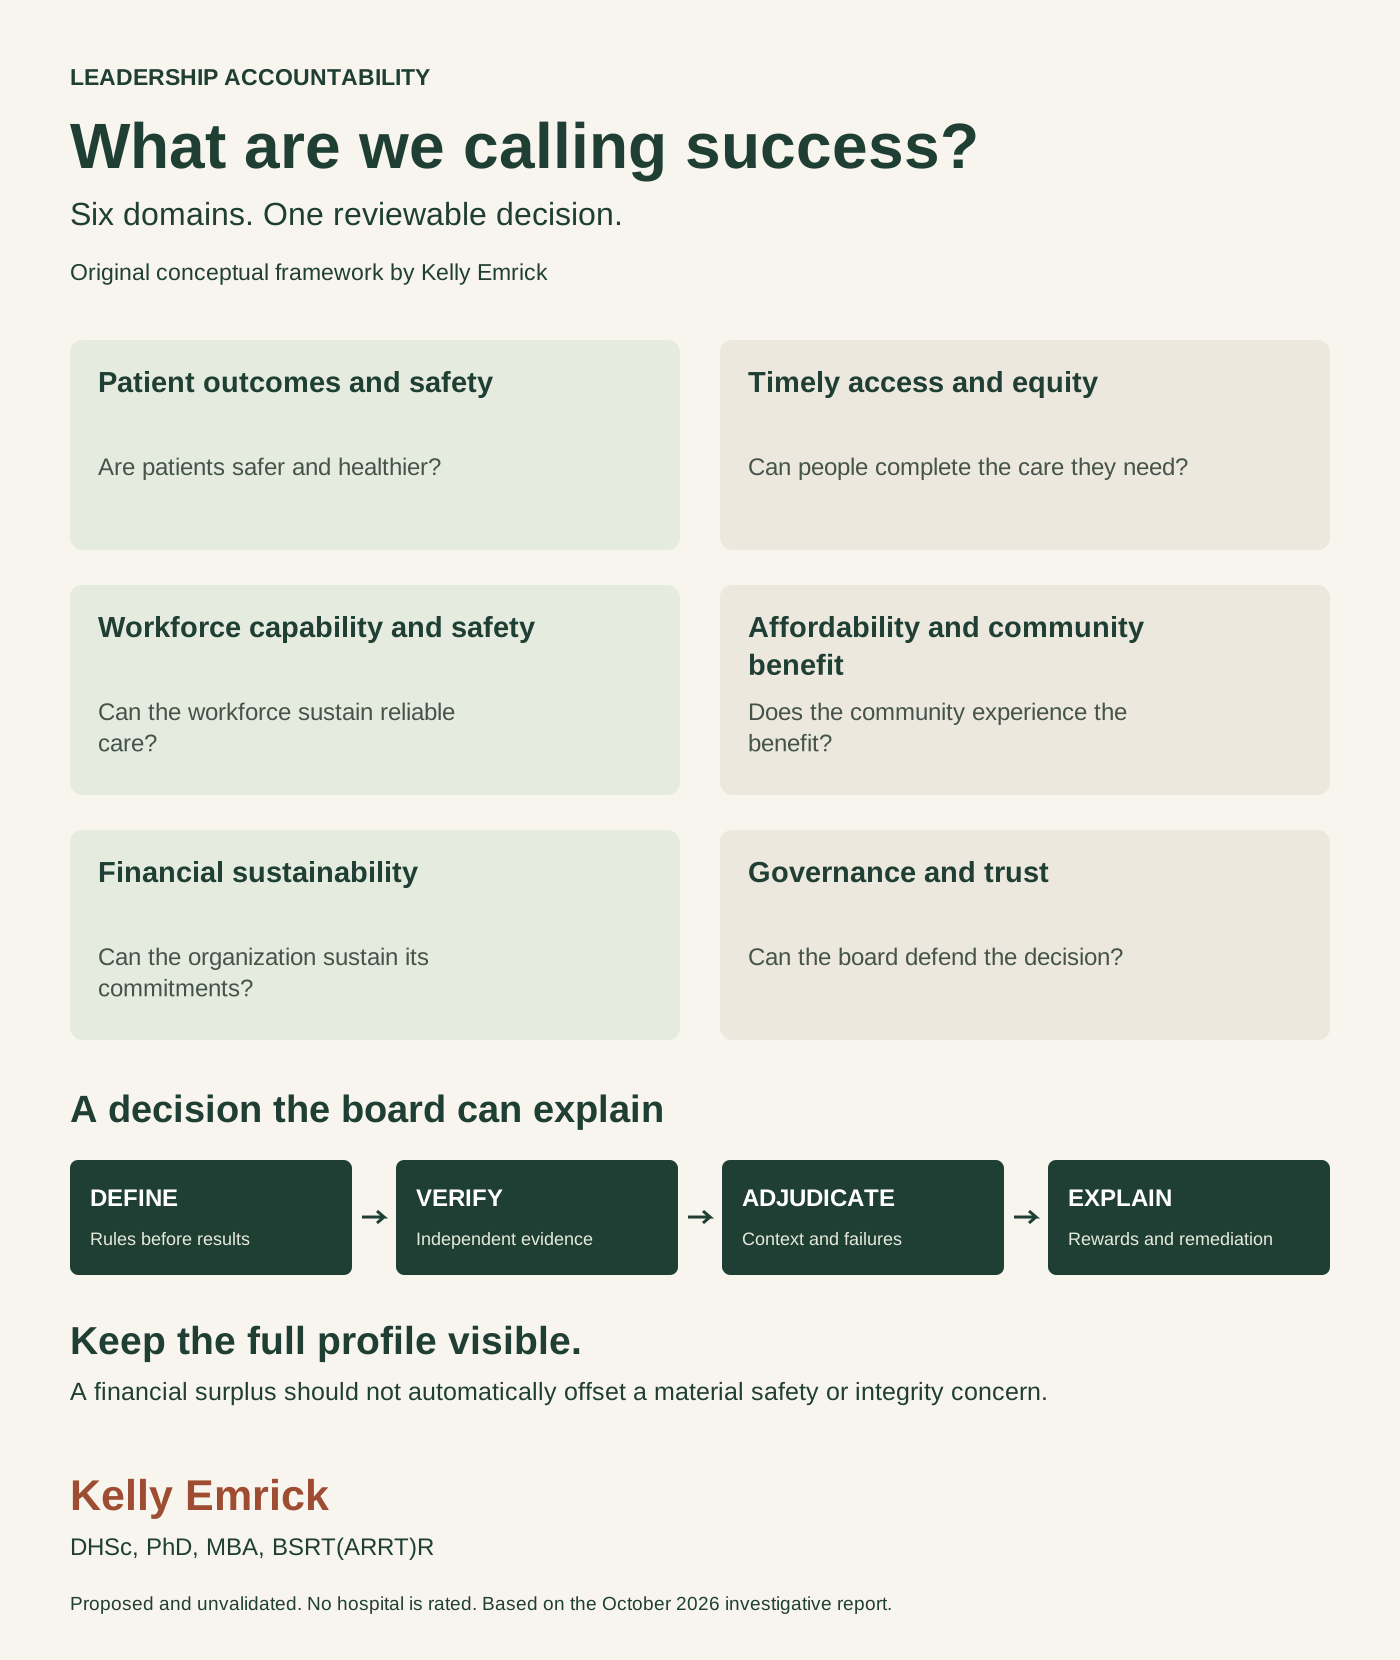
Six domains. One reviewable decision.
Success requires a complete performance profile and an explanation the board can defend.
Chief medical and nursing officers
Measure: Risk-adjusted outcomes using the selected measure’s published specification; selected harm rates with explicit cases and exposure denominators
Balance with: Show uncertainty and service level variation. Reconcile case review with coded records. Do not reward fewer reported incidents without checking reporting behavior.
A strong financial result should not automatically cancel a material safety or integrity concern.
Original conceptual model by Kelly Emrick. Proposed and unvalidated; no hospital is rated.
Designed exclusively by Kelly Emrick, DHSc, PhD, MBA, BSRT(ARRT)R